See SAMPLE REPORTS
Contact Us

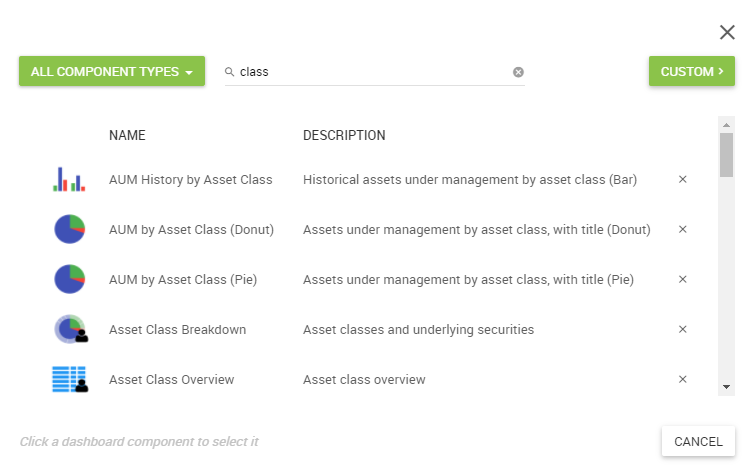
Portfolio reports can be customized by selecting report sections from a library of hundreds of data sets. Just drag them onto the page into the correct section.

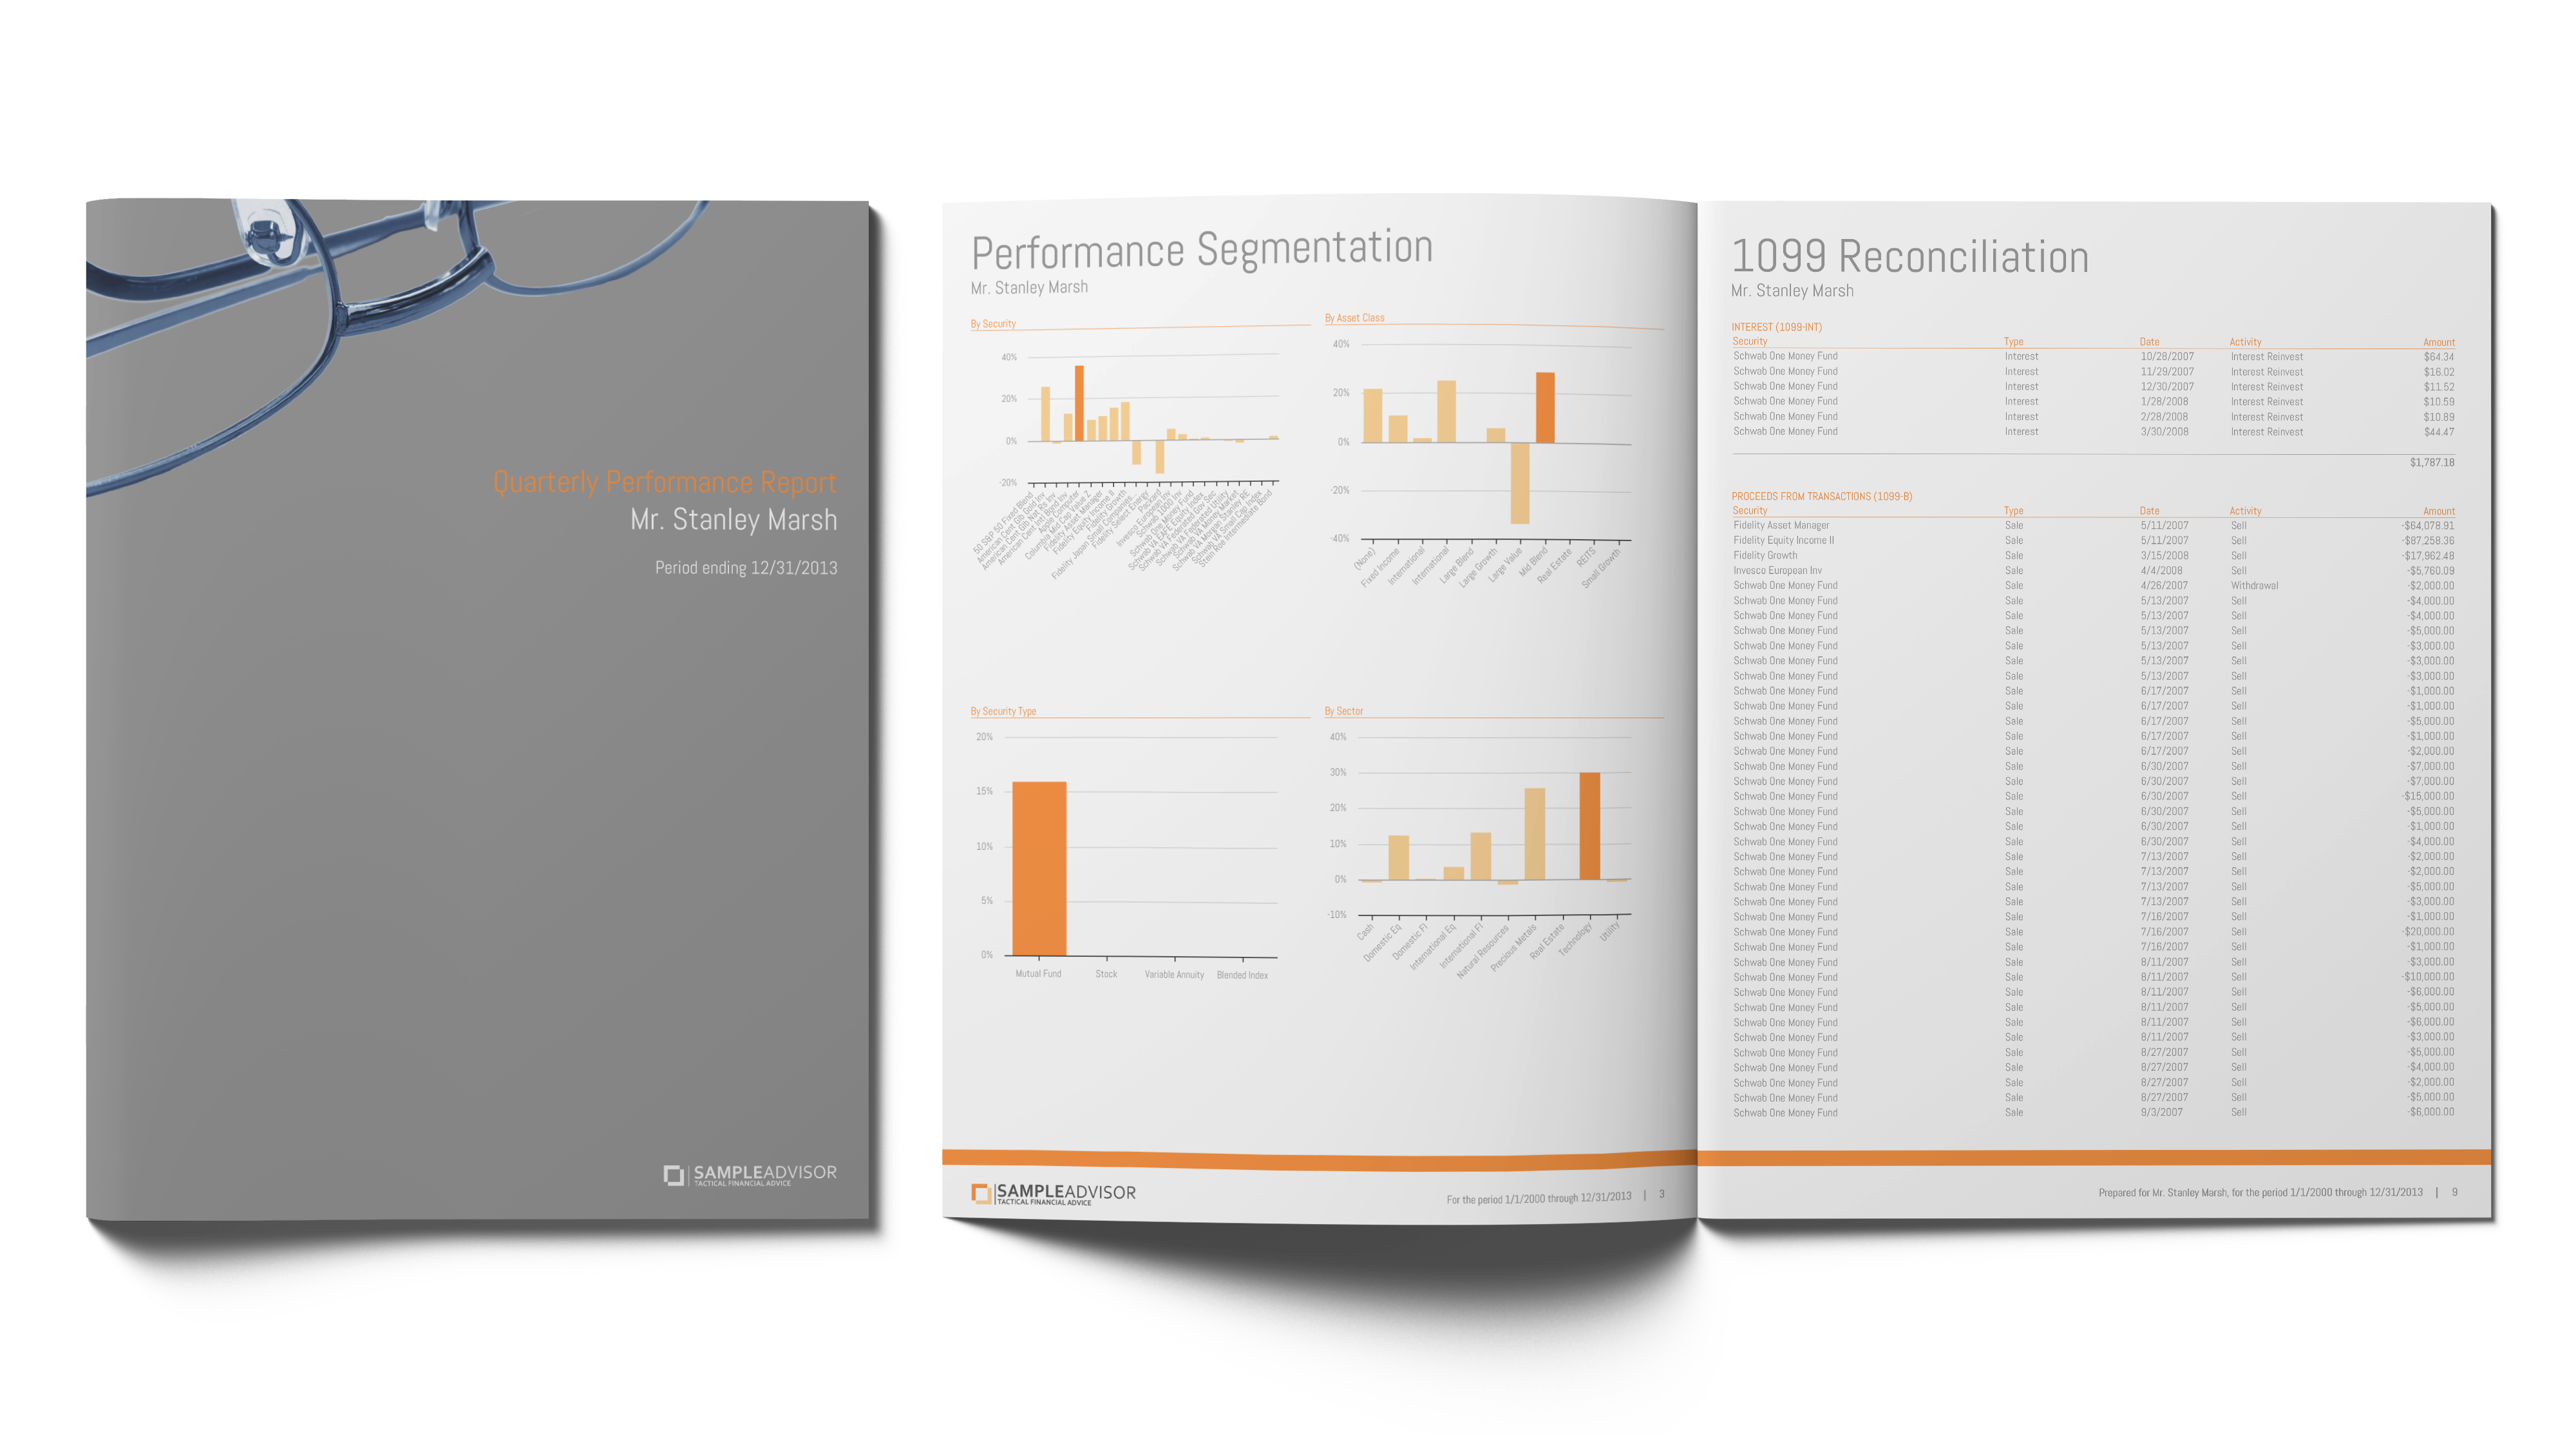
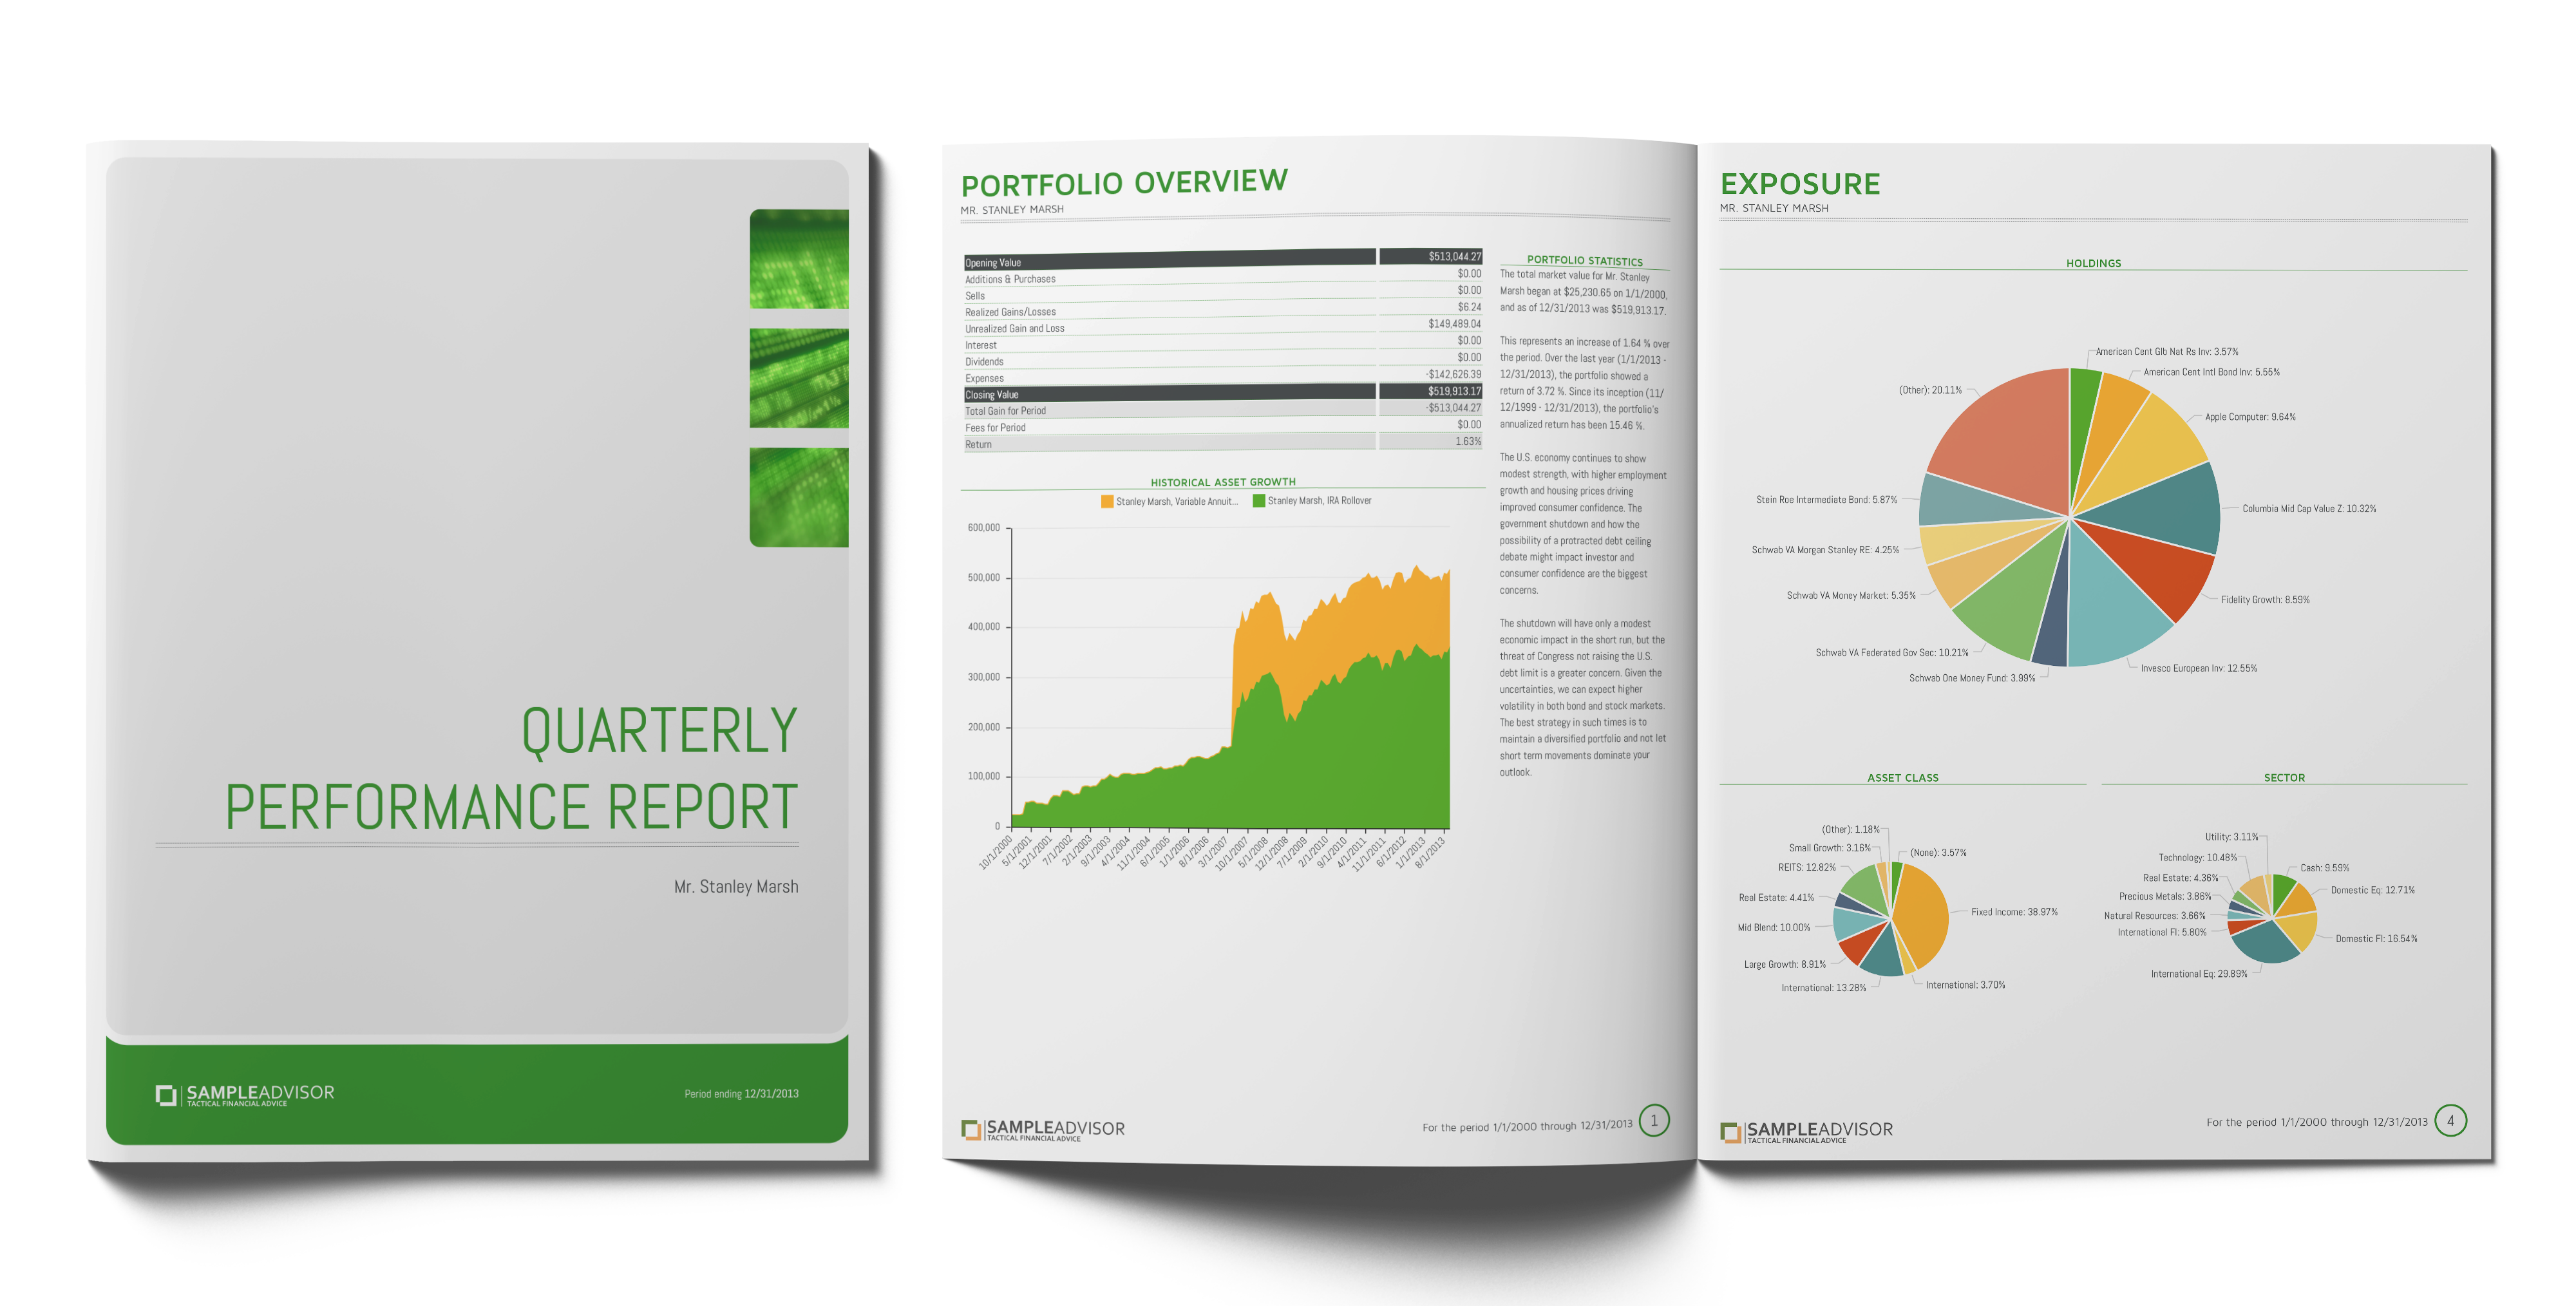
FinFolio has preconfigured templates for returns, index comparisons, asset classes, income projection, top holdings, and many more.

Every data type has numerous display options. Pie charts, bar charts, line and area charts. Detail and summary tables plus more exotic displays like multi-level pie charts and heat maps.

component_library.png
 

Analysis

Never be stumped by a client again. Show detailed analysis for each calculation right on the report. Justify every number, from rates of return to tax calculations.


Risk vs Return

Compare performance to blended indexes in tables and charts. Show return vs. risk graphically with attribution so clients understand all the value you provide, not just the return.


% Ownership

Accounts can be owned by more than one client and household with ownership and percentage splits. Great for partnerships and other tricky estate planning vehicles.

Flexible delivery

Reports can be printed to PDFs with beautiful themes. They can be uploaded automatically to your client portal, sent securely to clients via e-mail, or your firm can physically print and mail them.

FinFolio has households with strategies to complement your clients and accounts. Arrange the relationships into something that matches your investment strategy without modifying your custodial accounts.

FinFolio also helps you track your team. Attach the responsible team members to each folio and always know who owns each part of the relationship. See clients added/lost and how revenue has grown or shrunk for your producers.

folios.jpg