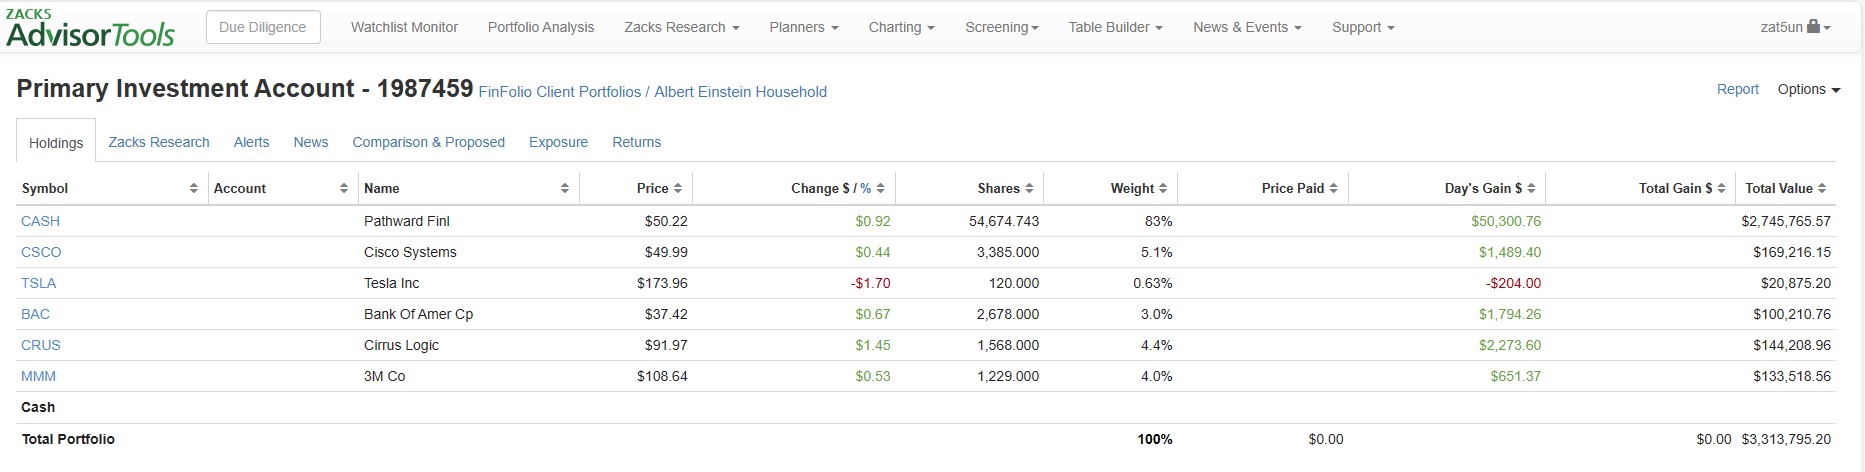
Skip Ribbon Commands
Skip to main content
FinFolio > Blog
 

 Recent Posts


1 - 30Next
 

 Categories


FinFolio is Hiring

FinFolio is a fun place to work and we’re always looking for good people. We are located in the Denver Tech Center close to the Arapahoe light rail stop. We dress casually, have “Margarita Fridays”, and take occasional Friday outings to see movie premieres.

I think the best part about working at FinFolio is that you’ll be working with a team of people who really cares about what they do. We service large financial advisory firms with high standards and we delight in making them happy. Our software is the best in the industry and the entire company sweats the details.

We’re actively hiring for several positions:

Development - Senior C#/WPF/SQL Developer (Technical Lead)

Development - Entry-Level C#/WPF/SQL Developer

Development - Entry-Level HTML5/JavaScript Developer

Development - Quality Assurance Lead

Support - Investment Software Specialist

We’re also interested in talking with students (or recent graduates) about internship opportunities.

Please contact us now if you’re interested.

margaritas.png

Quick Reports

Some of the feedback we’ve gotten over the last year is that FinFolio reports should be easier to print. Currently you print reports using the report wizard, which simplifies the process for large print jobs with report packages having many parameters. But it is a bit clunky to use when you just want to see a single report for a few folios. Based on feedback from our advisors, we’re rolling out a new feature in the next release called “Quick Reports”.

Here's how it works:

1. From any View or Edit screen, select one or more folios.

image

2. On the Reporting ribbon, click the Print button and select a report.

image

3. The report immediately prints and displays.

image

You’re never more than two clicks away from any report in FinFolio.

Analyzing Calculations

“Can you tell me why this rate of return is so low?”

A big part of portfolio management support is helping advisors determine how calculations arrive at their results. In Techfi, we had a rate of return wizard that would show you the excruciating detail behind the performance calculations—it was a well loved feature of the support team because it let them answer tough questions from advisors about their performance numbers.

But FinFolio has larger, more varied calculation library, and we needed better analysis tools. We’ve recently added an analysis framework that allows us to expose any of our calculations so advisors and our support team can see what’s going on under the covers.

You can open an analysis screen by clicking Analysis on the Report ribbon.

image

On the analysis screen you can select (a) a folio, (b) the calculation to analyze, and (c) a date range. You can also massage any properties and settings of specific calculations. When you click the image button, FinFolio will run the calculation and display all the intermediate steps that the calculation logic takes to arrive at the final number.

Here’s an example of the analysis of a market value calculation. Market value can include many sub-components like accrued income for bonds, which may cause it to be different from the market value you get from, say, a planning system that doesn’t calculate accruals.

(FYI, you can disable accrued income and other sub-components of market value in FinFolio.)

image

The structure of the analysis text differs depending on which calculation is being analyzed. Here’s another example where it displays the details behind an internal rate of return.

image

You can also tweak specific calculation properties for each analysis. This makes it easy to see how different settings affect the underlying logic.

image

This is a new feature that really seems to be appreciated by our clients. Although its biggest fans are on our support team. ;-)

Color-Coded Groups

Last Friday we rolled out two major enhancements to grouping:

  1. Created "static" color-coded groups that make it easy to lock down item groupings across large numbers of items.
  2. Moved the dynamic group functionality into the search bar, making it more accessible for the average user.

You customize groups with the Edit Groups screen. Each group can have a color assigned, which makes it easy to see missing groups from the main Views. Groups can be placed *within* other groups, allowing sophisticated hierarchies with minimal data entry. See the screen below where I placed the "Top" group within the "TLC" group:

Groups2 - Groups

Once groups have been created, select one more accounts/clients/securities/etc. on any list and right-click (or use the groups ribbon button) to place them in a group. This is also how you remove items from a group. You can add different item types to the same group. (i.e. put both securities and accounts in an "Immediate Review" group)

Groups2 - Add Group Menu

You can see item groups on every main View and all edit screens. When a group contains another group, the indirectly linked groups show up in grey at the end of the group list.

Each item type has a new "by Groups" view:

Groups2 - Accounts by Group

Any view can be filtered to show items in a group using the new search bar:

Groups2 - Search by Group

You can group almost anything, including households, portfolios, clients, accounts, securities, models and fee schedules. Groups can be used for billing, reporting, rebalancing and everything else in FinFolio.

Multi-Currency
I know from experience that it's very difficult to add multi-currency after you've created a portfolio management system. It needs to be added at a core level and affects every report and calculation.

Currency needs to be accounted for when you bill, rebalance, or perform any other action on your accounts. I don't like using the word impossible but it would have taken a *long* time to retroactively add multi-currency to Techfi and other systems I've built.

But this ain't our first time at the rodeo. We designed FinFolio to handle multiple currencies from the outset (despite a lack of multi-currency firms in the beta group). We knew how important it was longer-term so we did the work up front to made sure it was there.

How It Works

A local currency is entered on the security and account holdings inherit their currency from the base security. You can set a display currency at the account level, allowing you to have a common reporting currency when your account holds positions of different currencies.

Setting the global system currency determines the currency in which all your main lists will display. You can (optionally) specify currencies to use on each report, report column and in various places like on fee schedules or on the Positions tab.

Account View - JPY

FX Rates

You can see FX rates on the Exchange Rate screen, which lets you both view and edit. FinFolio lets you enter specific country-to-country exchange rates and doesn't force everything through one system currency. This prevents the currency rounding errors that you see in some other portfolio management systems.

Exchange Rate Editor

You don't have to hand-enter the FX rates; you can import them automatically from various pricing sources. Plus if you're a bit behind or otherwise don't have an FX rate for a certain day, FinFolio will find the most recent rate to calculate your values (just like prices).
 

Positions

When you display values or calculations in FinFolio, you can specify which currency to use. You can tell FinFolio to display values in the Local, System and Account currencies or select a specific currency. I'll give you some examples using our Positions tab, which is on many of our edit screens.
 
By default, the positions tab shows you current values in the local security currency for folio positions. Notice each currency is formatted correctly for the country and it's smart enough not to sum the columns.
 
Positions - Local Currency
 
On the next screenshot, I specified an as-of date and changed the currency to GBP. FinFolio now uses the FX rate and price on my date, totaling the values at the bottom of the list. All of this happens in real-time.
 
Positions - GBP
 

There's also a Positions tab on the Security edit screen which shows a cross-reference of accounts that own the security. Very handy.

Positions - Security
 

Reports

Instead of building a new batch of reports to support multi-currency we let you adjust the currency on our standard reports. You can select a reporting currency for each report, or you can set a currency for individual columns. Using some of the custom reports, you could add several currency columns, each one showing the Market Value (or other calculation) in a different currency.

Multi-currency Report

It's not just market values--all of the calculations are sensitive to multi-currency. We even expose the cash flow valuation currency on the return calculation. You can also set the currency on charts.


Multi-currency Chart
Chart: Performance

Our Performance chart is vey flexible and is the simplest of all the rate of return charts. It shows rates of return over time, broken out by any subgroup you choose to specify. You can do a wide variety of performance comparisons using this chart.

You can show either internal (dollar-weighted) rate of return, or a GIPS-compliant time-weighted return. It calculates the returns on the fly or -- at your option -- can use returns that you pre-calculated and stored. You can set the display period(s), and decide to display returns for individual securities, security types, classes, accounts, and much more.

Monthly by Security

Monthly by Security Type


Monthly By Account

Performance Periods

In the charts above, I set the Period Length to Auto, and in all cases it decided to show me the performance broken out by month. But with accounts that had been open longer it might have selected quarterly periods, or even annual. You can override the period length and tell it exactly what periods to use.

Stacked

Our bar charts have two other interesting formatting options. The first is a stacked bar chart, which emphasizes the proportional relationship between your item returns, rather than the returns themselves.

Cubes

The last option is "Cubes" which shows points instead of the entire bar. This really doesn't show anything different than the standard bar chart, but it provides a nice visual break if you're showing several bar charts on the same page, or have many pages of charts.

As with all of the other charts, they can be viewed on the screen and on your reports and you can change the color palettes and rendering types. You can change the chart/label display using percentages, names, security symbols, CUSIPs, etc. Like most charts, the Performance chart is flexible enough to be used over and over on different report sections, with each usage showing a different data grouping level or different display type.

Don't worry that it doesn't show indexes -- I'll show off our index comparison chart in a later post.

Notes

We don't have a CRM module for FinFolio, mainly because we went down that path at Techfi and it was a money-losing distraction. After I sold Techfi, Advent rolled the CRM into the main Portfolio 2000 application and I think it was a good decision. There are many good CRM providers  out there so with FinFolio we're focusing on integration with them, rather than rebuilding something that already exists.

However, FinFolio has several CRM-like features and at least a few users are using it as their main tracking database for client/account contact information. My favorite of these CRM-like features is the Note taking capability. You can take notes on any major FinFolio object, including Households, Clients, Accounts, Models and Fee Schedules.

Usually when you take notes on something in software, you have to open an item and go to the Notes tab before you can either see existing notes or enter new Notes. I've always found that limiting and it used to be one of my pet peeves with Outlook (but they fixed it in 2010). To avoid this in FinFolio, we implemented Notes in a tool window that sits beneath your main screen.

Putting the Notes beneath the main screen lets us display notes on main lists, edit screens or within wizards. You can open a list of clients/accounts/etc., open the notes window, and quickly walk through a group of clients to see who has been calling and what the open issues may be.

Editing or adding new notes is very easy -- just click in a note and the free-form Note immediately displays edit fields for each of the component parts. You have a dropdown for a note category, so you can group together Trading notes or those from Client Meetings. You can change the color and weighting of individual words, and the editor has a spell-checker that underlines misspelled words in red, just like Microsoft Word. Just right-click on a misspelled word and you can select the correct spelling from a list.

You can pin notes, making sure they don't get lost in the clutter. For example, if you have an important note about trading restrictions, you can pin that note and it will always show at the top of the note window for that account.

If you open a client or household, you can select "View Related Items" in the Notes tool bar. This will load all notes for any related portfolios, accounts, or anything else in the tree for the parent item.

Perhaps the best part about having the Notes in a tool window is that you can close the notes  when you're working on something else, freeing up valuable screen real estate.

Chart: Market Value

The Market Value chart is the simplest of FinFolio's ten+ charts. It displays a static snapshot of a folio's values as of a date. If you place it on a report, it defaults to showing the values on the last day of the report period, but it can also show values on the first day of the period, last day of the year, or any other date.

Just like our reports, our charts have a deep array of customization properties that extend their usefulness. Using the default settings, a Market Value chart will display an account's securities in a simple pie chart. By drilling into the chart properties, you can display market values for almost any slice of data, like accounts, household members, asset classes, security types, sectors, and more.

You change the market value data slices by setting the "Grouping" property, causing the folio to be broken out into the specified groups. If you select "Security" and display the chart for a household, all unique securities across all household members will be grouped together and displayed on the chart:

...or if you select "Members" then all household members will be displayed.

Another customizable feature is the Chart Type. This lets you decide how best to display the market value data. For this chart, you can use a pie/donut, bars and tree maps. For example, if you set your grouping level to "Security" you can display a donut...

...a bar chart...

...or (if you have a high tolerance for replacing printer toner) a Tree Map.

You can change the chart/label display, using percentages names, security symbols, CUSIPs, and more. All charts options can be used on the screen or on reports. On reports it becomes important to have the ability to fine-tune the chart colors and other look and feel options, so the market value chart has access to the standard array of FinFolio palettes and rendering types.

This is just one chart of the 10+ charts we currently have in FinFolio. The chart can be used over and over on different report sections, with each usage showing a different data grouping level or different display type.

Data Quality IV - CleanData™

CleanData™ is what we're calling FinFolio's global error tracking system. Our bold claim is that CleanData™ eliminates data problems. Or more accurately, it identifies and highlights any problems in your data so they can be easily cleaned up by your operations team. We've made it virtually impossible for there to be bad data in your software without you knowing about it.

Data quality problems are like viruses--if you catch them immediately, they can be easily fixed. But the longer a virus stays in your system, the more damage it can do, just like not finding data errors until you print quarterly reports (months after they happened) makes it much harder to fix them. CleanData™ is our industry's equivalent of anti-virus software.

This is the tool we always wanted for Techfi's AdvisorMart service bureau. It was frustrating not having a quantifiable way to measure data quality. We knew there were issues with data but didn't have the tools to identify the problems, which meant we couldn't fix them. We couldn't monitor the production of individual employees and were constantly worried about losing certain key people on the ops team.

For newcomers, you can read about our development process for CleanData™ and how it works here:

Some examples of how quantifiable data quality measurement impacts FinFolio and ancillary systems:

Conversions - CleanData™ works in real-time no matter where the data comes from, including converting from your old portfolio management system. We've converted several systems so far and, in every case, found problems with their old data -- data the user thought was perfect.

Custodial Imports - Usually it takes months (if not years) to work out the kinks of a new custodial interface. But CleanData™ uncovers interface problems very quickly; we can build a new interface in a matter of weeks.

Outsourcing - Complaints about data quality are par for the course with portfolio management outsourcing. Some outsourcers are better than others, but they're all dealing with the same systemic problems. But now, if the outsourcer is using FinFolio, you have access to CleanData™ so you will know if there are data problems.

Trading - Having correct custodial balances is critical if you are trading from your portfolio management data. As rebalancing systems have grown more sophisticated and now incorporate tax-optimization techniques, matching system balances isn't enough. You need to know that all your open tax lots are correct--the balance checks run by most systems don't check your open lots.

Employee Turnover - When a firm becomes dependent on one or two operations people for their data quality, it creates a scary situation. What if the person quits, or goes on vacation? FinFolio gives you a framework for locking down the large block of institutional knowledge contained in your key operations people. FinFolio's error system pushes most of the institutional knowledge into the software, making it easy to rotate and train new employees.

True innovation only comes along once every few years, and we think CleanData™ is the biggest leap forward for portfolio management in a long time.

Data Quality III - Presenting the Errors

The problem with the many-small-checks approach to finding data errors (see Part II) is that the process is more complicated than the simple "balance check" report that most operations teams are familiar with. Most teams check custodial balances by running the balance check report, doing some data cleanup, then running the report again to see if the problems were fixed.

When you have twenty interlocking checks and balances, having separate reports for each rule makes it difficult to track down problems. You would make a change that fixed one rule but broke another, and you couldn't see the correlation -- errors would seem to randomly jump between reports. We needed something that could display all the errors for an account in one place that would update in real-time as users made changes to their transactions.

We created a tool window that displays below the current account that the user was working with. This tool window shows any errors that currently exist for the account and it updates as the user makes changes. Seeing how a particular change affects the account makes it easy to detect error patterns and determine whether a certain change fixed a problem.

We display high-level errors on account lists so users can see error patterns that stretch across multiple accounts. We decided to make these high-level errors visible to everybody in the system, not just the operations team. After all, if your data isn't clean, the entire company should be aware so they don't trade or print reports with incorrect results.

If the entire company sees data errors, it is important that the operations team be able to troubleshoot problems before data is posted to the system. So all data errors work in both Pending and Posted modes, allowing you to fix data problems while your trades are still Pending in the trade blotter. (the main lists only show errors with Posted data)

We're very happy with the end result. The feedback we've gotten is that our dynamic error tracking is much easier to work with than static balance check reports in other systems. And they certainly uncover more problems.

(continued in Data Quality IV - CleanData™)

1 - 10Next